

Quick lube, multi-store

High-mileage analytics for a multi-store quick lube group

The owner wanted to know whether high-mileage cars were being offered the right service at the right price, at every store. We built a mileage report from the data his POS already had.

We keep client names private. This page covers the question, what we built, what the client's team reported back and what's being added next.

Published · Updated

At a glance

Client name kept private

Business
Quick lube, multi-store
What we built
  • A mileage report from POS and shop-software data
  • A retention view by oil type
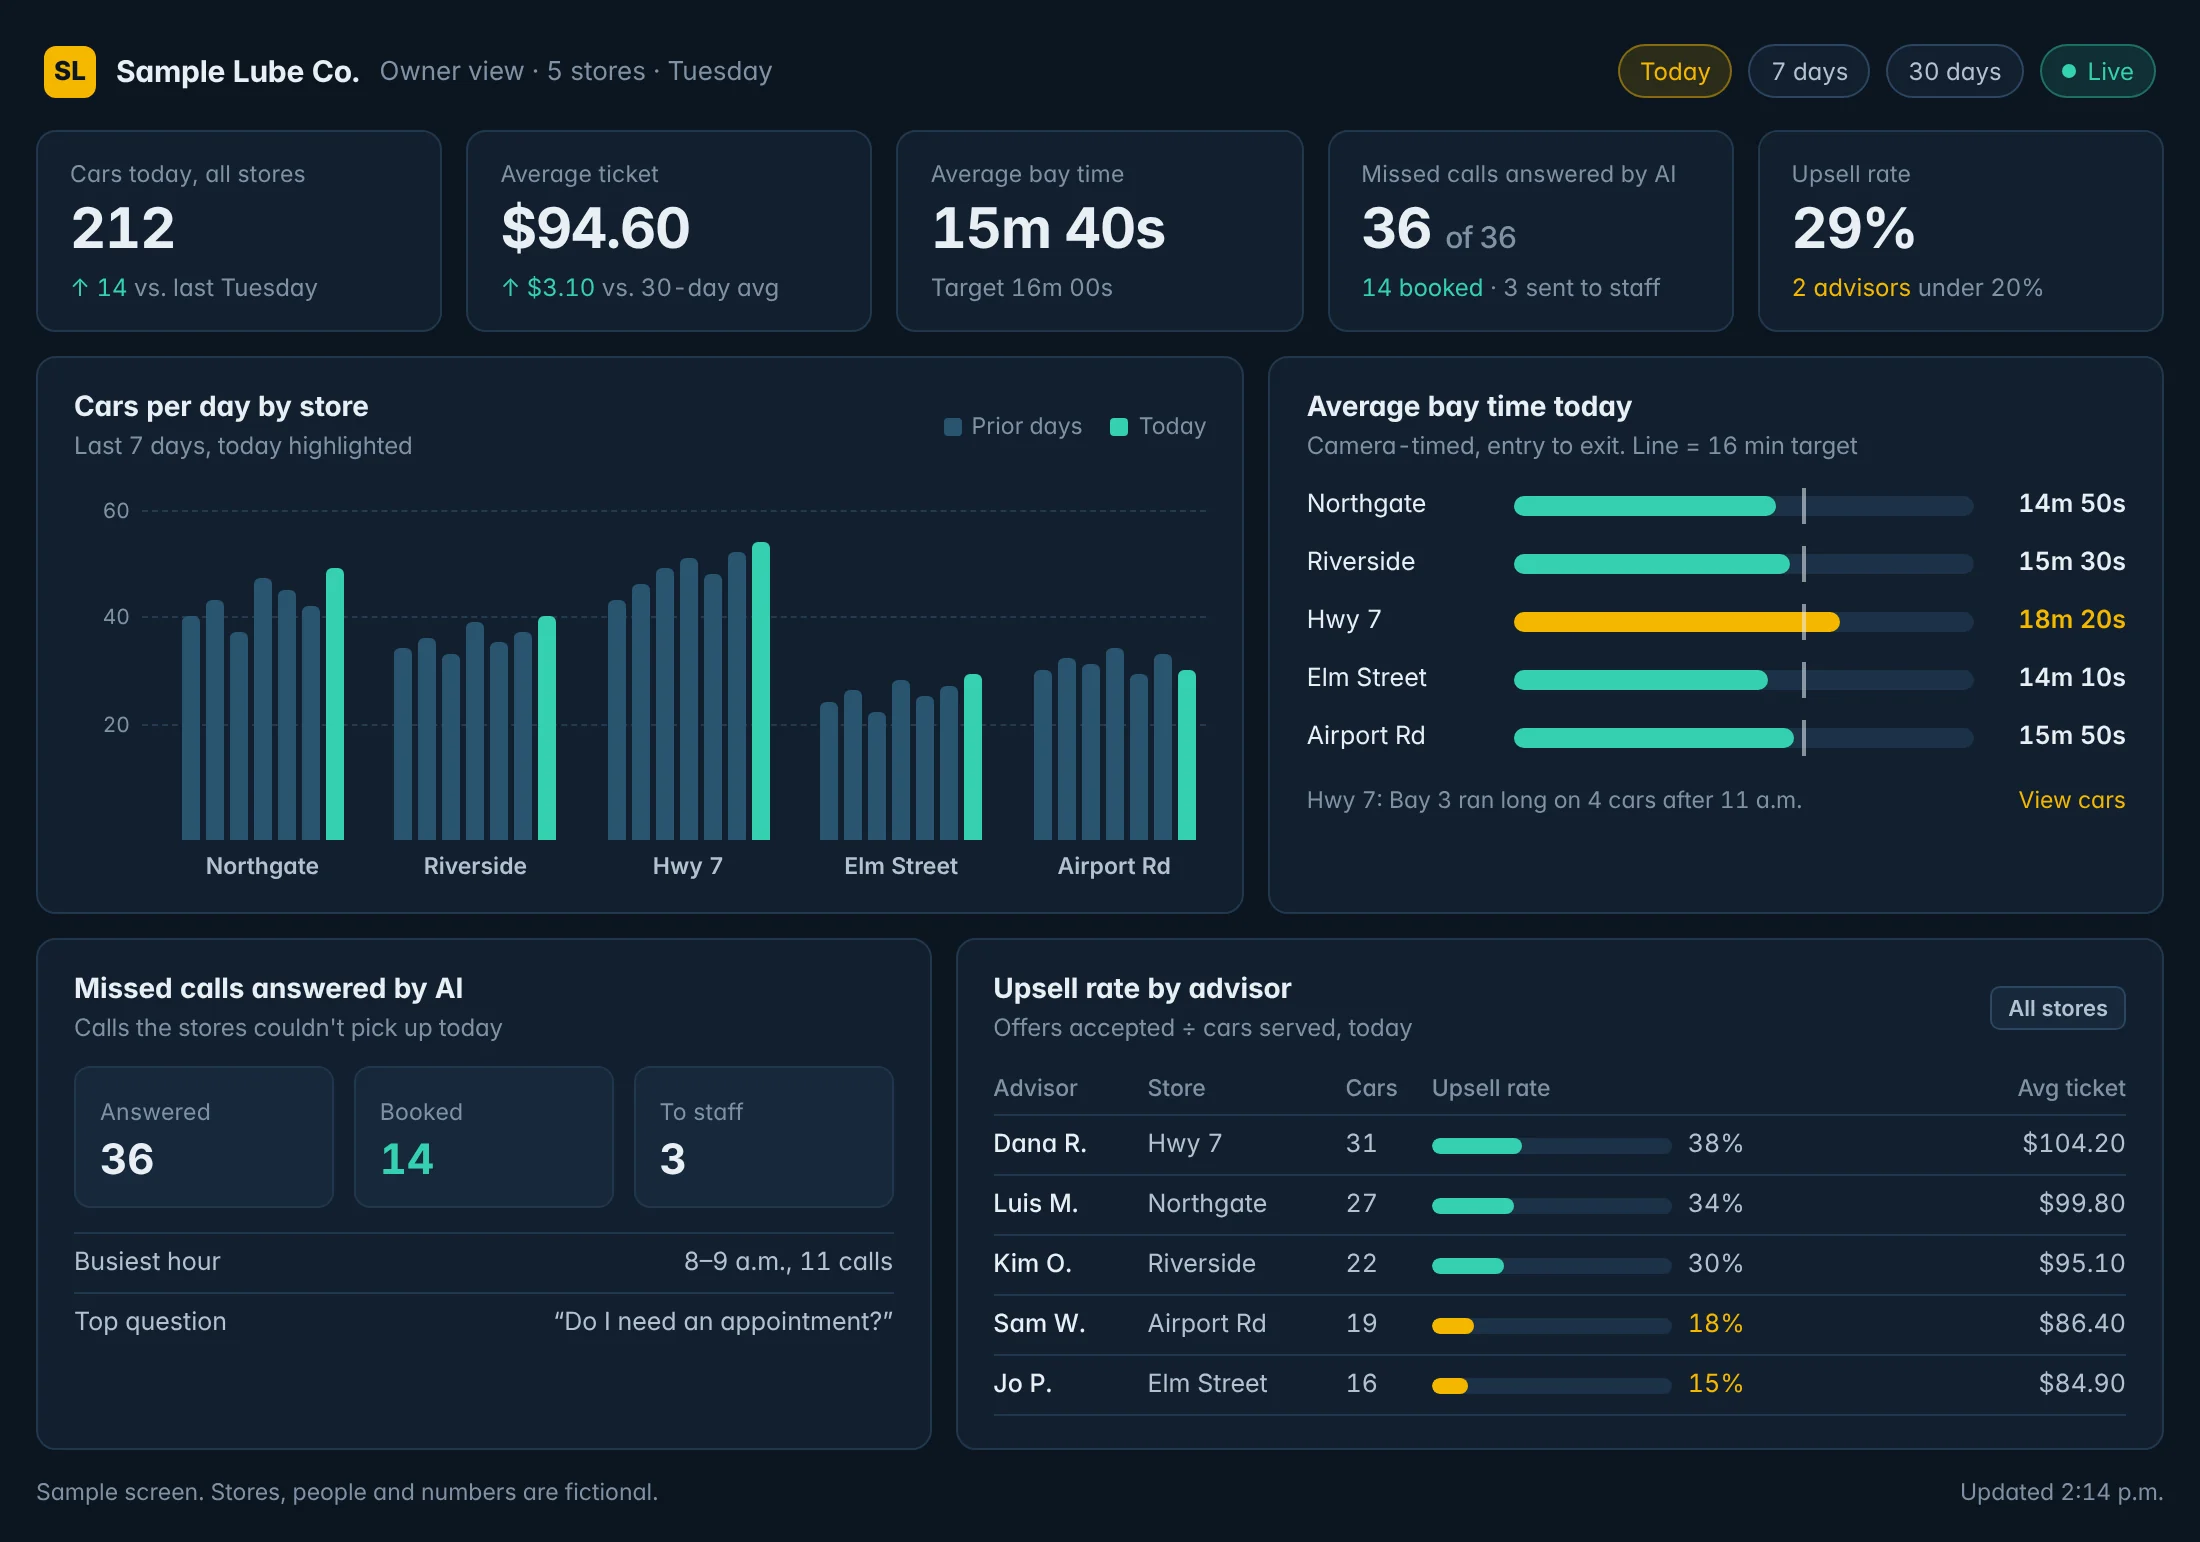
Owner dashboard for a five-store quick lube: cars today, average ticket, bay time, missed calls answered by AI, cars per day by store, bay time by store against target, and upsell rate by advisor.
Multi-location quick lube owner dashboard.Sample screen, fictional data.

The question

This group runs several quick lube and auto service stores. Like a lot of lube owners, they run a high-mileage offer: a different oil and price for older cars. The owner's question was simple and hard to answer from the POS screens: are the cars that should get that offer actually getting it, and is it priced right?

The POS had every visit, odometer reading and oil type. What it didn't have was a view that put them together by mileage and by store.

What we built

A mileage report from POS and shop-software data

For the last 30 days, by store and for the group:

  • Visits and unique vehicles
  • Average mileage
  • Mileage bands, so the owner sees how many cars sit in each band
  • A store-by-store breakdown, so one store's mix can be compared with another's

A retention view by oil type

Miles and time between visits, split by oil type. It shows how long customers on each oil go before they come back, which is the number the owner needs to judge whether an offer brings people back sooner or just discounts a visit that would have happened anyway.

What the client's team reported

On a call on October 29, the client's team told us the high-mileage promotion was running at 17% penetration against a 15% goal, and that the report now feeds their pricing decisions.

Those are their numbers, measured on their own data. We're sharing the result they stated, not a projection.

Also live: repair videos by error code

Techs can search the group's repair videos by error code and get the steps, parts, tools and key moments, with questions answered from the video transcripts. It means less time hunting for the right clip with a car on the lift.

What we're adding now

These are in build, not shipped yet:

  • Call grading against the phone script, so managers see which calls followed it.
  • Declined-work follow-ups, so a declined service gets a follow-up instead of being forgotten.
  • Warranty follow-up checks.
  • Time on the car against hours sold, by tech and store.
  • A green and red execution scorecard for each store.

What this means for other quick lube owners

Your POS already knows each car's mileage and oil type. Put those two together by store and you can see whether your high-mileage offer reaches the cars it's meant for, and whether one store offers it far less than the others. Our guide to quick lube KPIs by store covers the rest of a store scorecard, and oil change upsell scripts covers the conversation at the car.

For the camera side of the same business, read how another multi-store quick lube checked its bay camera count against the POS. See how it all fits on the quick lube industry page and the owner dashboard.

Questions about this build

Something else on your mind? Ask us directly or call 416-262-2723.

What did Trilix AI build for this quick lube business?

A mileage report from POS and shop-software data. For the last 30 days, by store and for the group: A retention view by oil type. Miles and time between visits, split by oil type.

Is this quick lube build a live client system or a demo?

It is client work for a real business. We do not publish the client’s name, because it is their data, not our marketing. This page covers what was built and how it runs day to day.

Want to see your stores by mileage band?

Tell us which POS you run. We'll show you what a mileage and retention report would look like on your own data.